Alluvial Data Visualization
Using Alluvial Graph to visualize overlapping tags
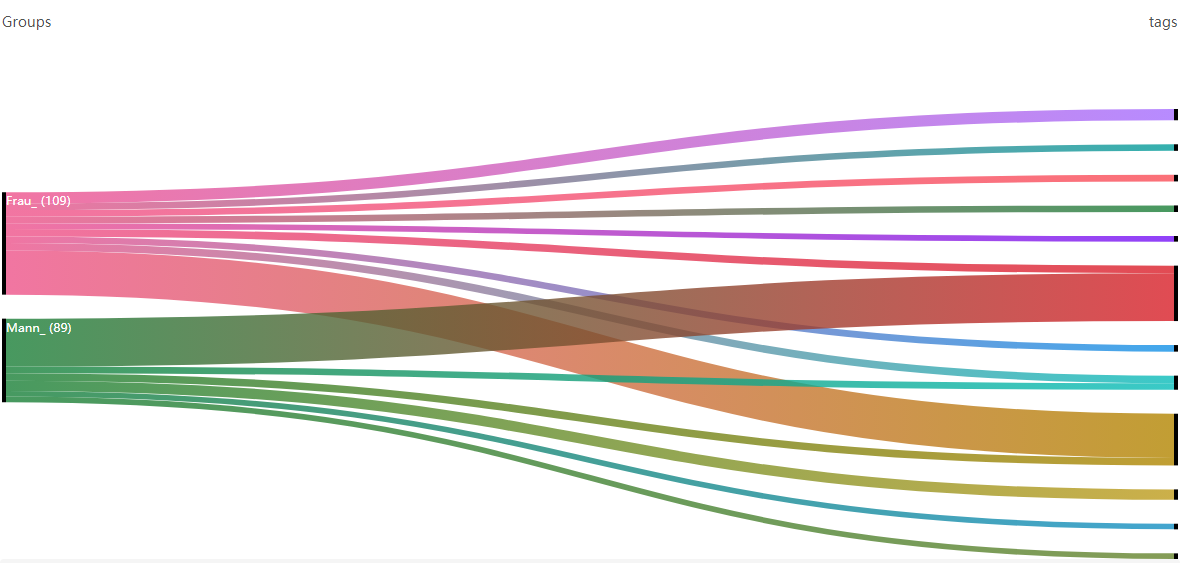
Taking inspiration from Max’s example, I decided to use alluvial graph to chart the top-occuring tags between “man” and “woman” pictures as a different visualization method.
Here’s the link to the Observable notebook: https://observablehq.com/d/245e9fed46b31fc7