Data Visualization
Max Frischknecht Presentation Data visualization
As written in the instructions, I went through the tutorial in the link to Max’s website and working with PIA Metadata API. Results below:
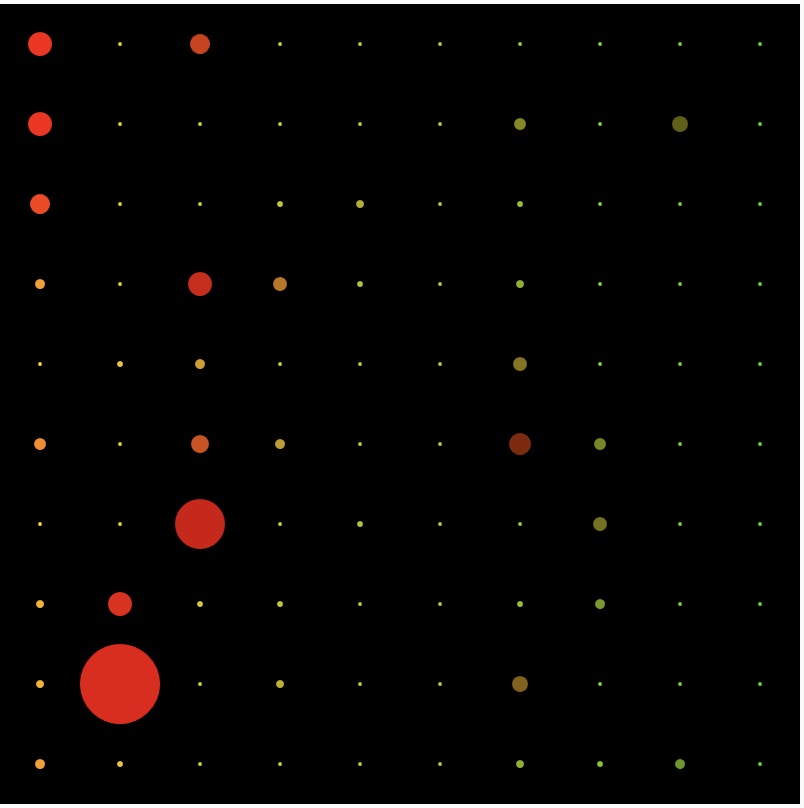
 I also took a look at the visualization software, and made some changes to use different data fields to impart some meaning on color as well as location: